Ultrasound of the Week #009
Here is a classic case that demonstrates well a few uses of M-Mode and some aspects of RCEM Level 1 and Level 2 Echo assessment.
Many thanks to Dr Ahmed Abdul-Ghani for this case and images.
Case:
A 55yr male with no previous cardiac history presented with a 2-3 week history of malaise, poor oral intake, worsening shortness of breath and swelling in his legs. He had no history of chest pain. COVID-19 swabs done in the community were negative.
His presenting CXR is shown below:
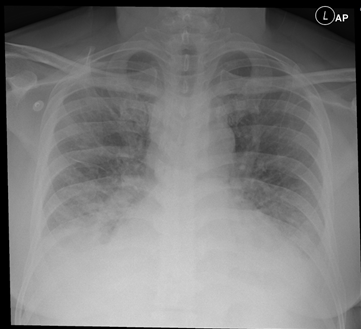
Bedside echo confirmed the diagnosis of LV failure and allowed swift implementation of appropriate treatment. Below are some images from this patient demonstrating how M-mode can be used to assess cardiac function.
What is M-Mode?
‘M-mode’ is ‘time-motion-display’ of ultrasound along a chosen line. Basically, it shows ultrasonic reflections along the chosen line across time. It can sample at very high time resolution and frequency, allowing for assessment of rapid motion (e.g. cardiac valve leaflets). Imagine it as a recording of the motion of all objects in that one ultrasound beam across time.
Below are all demonstrations of ‘M-mode’ from this case and how they can be used to make an accurate diagnosis. We have arranged them into Left and Right Heart assessment tools – use these to conceptualise cardiac pathophysiology and how they relate to a patient’s issues and appropriate treatments.
*Important Note: M-mode assessments are at risk of significant measurement error. The M-mode cursor must be perpendicular to tissues when measuring diameters (e.g. EPSS/fractional shortening) otherwise distances will be overestimated. Equally, when making diameter assessments of tubular structures (e.g. aorta, IVC), M-mode is not recommended for making definitive measurements as one cannot be certain the M-mode cursor remains through the centre of the structure. 2D static measurements are more accurate in these situations.
Left Heart Assessment:
There are many different ways to measure LV function. The following are a couple that use M-mode and with training are quick and easy to do at the bedside.
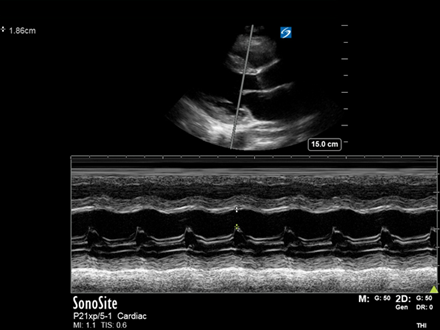
E-Point Septal Separation (PLAX): covered previously in USOTW 006, EPSS is a rough guide to ascertaining whether LV systolic function is normal or abnormal. Here EPSS is significantly over 7mm implying reduced LV contractility and reduced LVEF.
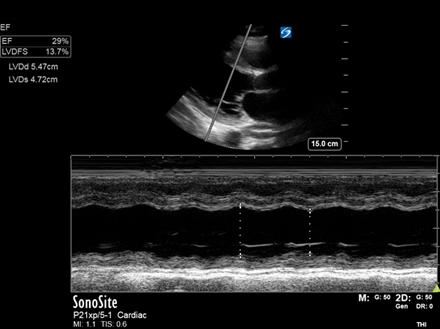
LV fractional shortening (PLAX): a more quantitative method for estimating the LV ejection fraction. This image shows a dilated LV and an estimated LVEF of 30%, consistent with severe acute LV systolic dysfunction. *There are many more accurate quantitative methods of assessing LVEF but these take considerably longer (e.g. Biplane Simpson’s)
LVDd = LV Diameter (diastole). LVDs = LV Diameter (systole). LVDFS = LV Diameter Fractional ShorteningRight Heart Assessment:
The Right ventricle is complex and assessment can require advanced measurements. Basic Right Heart function assessment is done principally through measuring RV longitudinal function with TAPSE and estimating RA pressures (IVC), as well as pulmonary pressures measurements (more advanced).
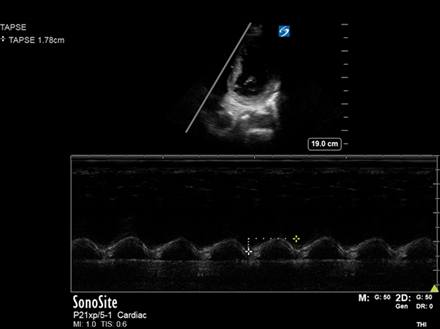
Tricuspid annular plane systolic excursion (TAPSE): performed in the Apical 4 Chamber view and looks at the longitudinal movement of the lateral tricuspid valve annulus as a proxy marker of RV longitudinal function (as much of RV contraction occurs longitudinally).
Normal TAPSE is 16-25mm. Here it is preserved (>15mm) and denotes intact RV function.
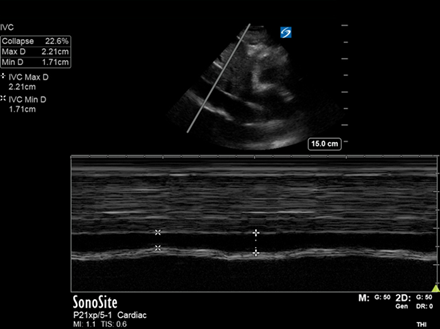
IVC diameter and variation: in this case was upper end of normal (as measured on M-mode*).
The IVC is a surrogate marker for CVP/RA pressure. Taken alone, it can only tell you about this, and must be used in conjunction with other assessments/clinical context (more on this in a later case).
Important note…not all heart failure patients will have dilated IVCs. The IVC does not correlate with fluid responsiveness[3].
Summary:
- EPSS & LVID Fractional Shortening are 2 quick ways to assess LV systolic function at the bedside yet are prone to error so must be interpreted with care
- TAPSE is performed in the Apical 4 Chamber view and measures RV longitudinal function
- IVC measurements can give an estimate of RA pressure. Interpretation must be in conjunction with other assessments
- B-lines on lung ultrasound can signify interstitial syndrome of which one differential is LV failure, inferring raised LA pressure
Conclusion:
The patient has LV failure but does not have an established CCF picture with biventricular failure as RV systolic function was preserved.
The patient was admitted and formal ECHO concurred with a picture of acute heart failure with moderate to severe LV failure and preserved RV function. He went on to have cardiac MR and is being followed up by Cardiology.
References:
- C Brown, Evaluation of left ventricular function by bedside ultrasound in acute toxic myocarditis, J Emerg Med, . 2013 Oct;45(4):588-91.
- A Weekes, E-point septal separation compared to fractional shortening measurements of systolic function in emergency department patients: prospective randomized study, J Ultrasound Med, 2012 Dec;31(12):1891-7.
- E Long , E Oakley, Does Respiratory Variation in Inferior Vena Cava Diameter Predict Fluid Responsiveness: A Systematic Review and Meta-Analysis, Shock. 2017 May;47(5):550-559.