Ultrasound of the Week #006

There’s a lot in this case – A brief look at lung ultrasound and then some interesting echo findings. I’ve divided the echo findings into sections roughly appropriate for an operator’s level of echo experience so browse at your own interest.
Case:
A 54 year old gentleman with a background of T2DM and Hypertension attended extremely short of breath. He had been completely well when he went to bed at 2300 the night before. He had had no chest pain, no fever and had otherwise been well recently. He was an ex-smoker but denied any breathlessness like this before.
On arrival SpO2 was 88% with a Resp. Rate of 34. He was tachycardic at 104bpm with a good BP.
A quick echo & lung ultrasound were performed at the bedside, giving the diagnosis.
Lung Ultrasound:
L2
R2
R4
These images show a large number of ‘B-lines’. B-lines are a reverberation artefact produced by very closely spaced reverberations at distances below the resolution of ultrasound[1]. These are representative of ‘alveolar-interstitial syndrome’. Common causes include pulmonary oedema and infection.
Echo Images:
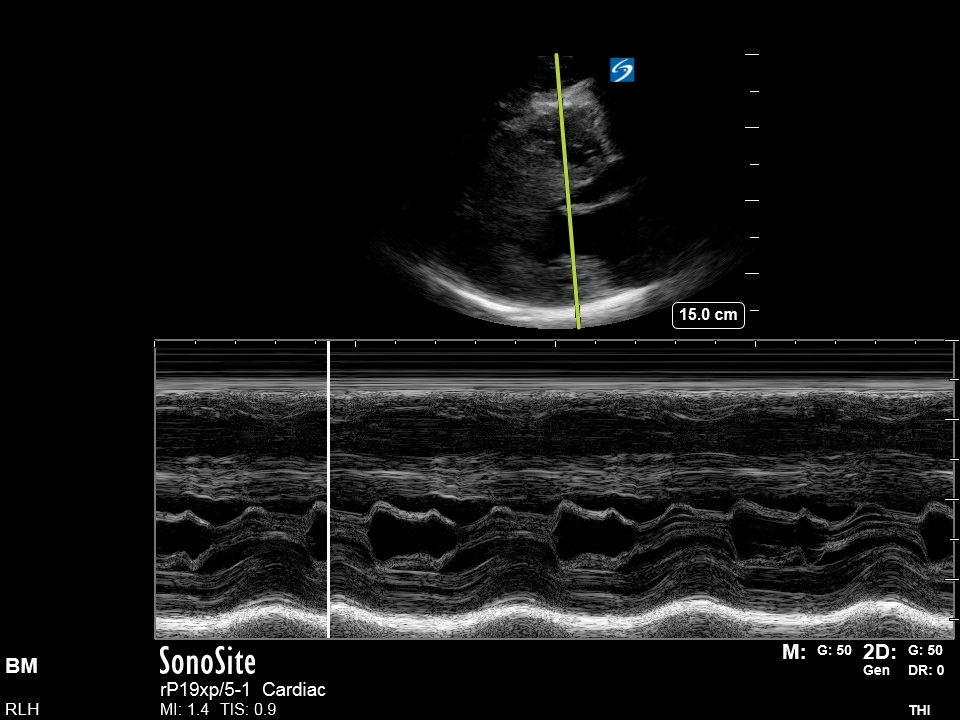
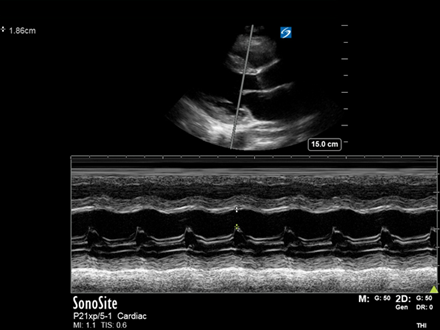
[expand title=”Parasternal Long Axis (PLAX):” rel=”echo”]The LV walls are not moving in a coordinated fashion and not squeezing together effectively. You can also see that the Anterior MV leaflet (AMVL) does not come up and ‘slap’ the Interventricular Septum (IVS). (This is quantified by the ‘EPSS’ – E-Point Septal Separation (see the ‘Advanced Techniques’ section below).
[/expandsub1][expand title=”Parasternal Short Axis (PSAX):” rel=”echo”]
[expandsub1 title=”What does this show?“]
This shows a significant Regional Wall Motion Abnormality (RWMA). You can see that the top left (9-12 o’clock) area is moving significantly less than the rest of the LV walls. This corresponds well to the territory supplied by the LAD.
[/expandsub1]
[expand title=”Apical 4-Chamber (A4Ch):” rel=”echo”]
[expandsub1 title=”What does this show?“]
Here again it can be appreciated that the LV function visually is poor, with generally poor LV squeeze and again notably reduced movement at the apex (LAD distribution).
[/expandsub1]
[expand title=”Subcostal view (SC):” rel=”echo”]
[expandsub1 title=”What does this show?“]
This view demonstrates well the poor LV function, with generally poor LV squeeze.
[/expandsub1]
[expand title=”Conclusion…” swaptitle=” ” trigclass=”noarrow” rel=”echo”]The above findings clearly demonstrated a patient in decompensated LV failure likely secondary to an LAD myocardial infarction. His case was discussed with cardiology and he was admitted. [/expand]
[expand title=”Learning Basic Echo views #2 : the Parasternal Short Axis (PSAX) View:” tag=”h2″ rel=”learning”]
The parasternal long axis (PSAX) view is the second view generally obtained in a focused echo study. It gives a great visual assessment of LV function and Regional Wall Motion Abnormalities (RWMAs.)
Obtaining the view:
Patient : imaging will be easiest in the left lateral position if the patient can tolerate it as the heart ‘falls’ towards the probe.
Probe : find your PLAX view (see last week’s email for details). Rotate the probe clockwise on it’s axis 90⁰, so that the probe points to the patient’s left shoulder. Tilt the probe until you find the level you wish to assess. Doing this you can pan from LV base to apex.
What to assess?
- Is there good LV squeeze? All the LV walls should come in together towards the centre, significantly reducing the LV volume in systole.
- Is there a RWMA? Is one wall moving less than the others?
Troubleshooting the PSAX view:
- This view can be difficult to get in between ribs. If you’re struggling try going back to the PLAX and starting again, rotating from a good PLAX view 90⁰ clockwise.
- If possible always position the patient in left lateral.
More Advanced Echo Techniques : E-Point Septal Separation (EPSS)
See the below M-mode image taken in the PLAX view. (EPSS can also be done in the PSAX view):
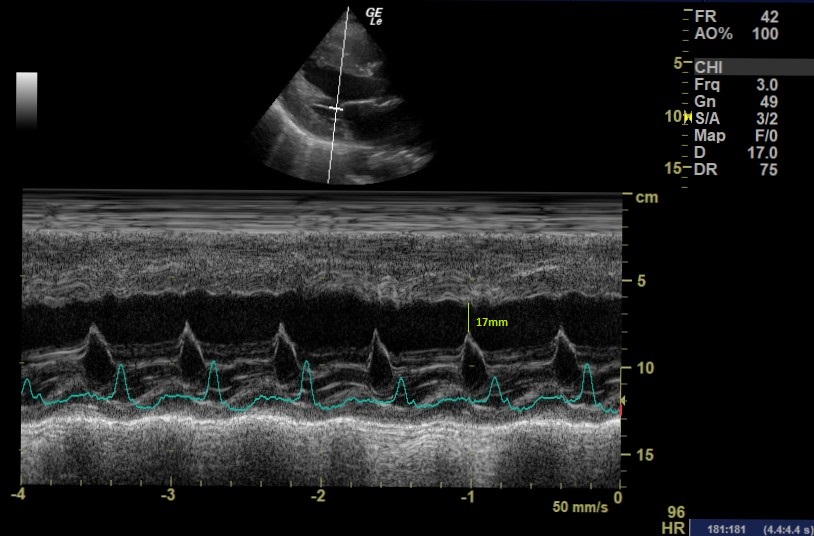
- EPSS measures the distance between the peak height of the MV (E-point) and the IVS. It is obtained through passing an M-mode cursor through the IVS and the end of the Anterior Mitral Valve Leaflet (AMVL). The IVS must be perpendicular to the M-mode cursor so this cannot be done if off-axis.
- An increased EPSS (>7mm) indicates a reduced LVEF.[2] There are some caveats – significant MS or AR will make this an unreliable measure and it should not be relied on alone.
The EPSS in this case was 17mm indicating significant LVEF impairment.
[/expand]N.B:
- There are considerably more advanced techniques than those displayed here but they are rarely necessary in the ED setting.
- We should never report something beyond our level of accreditation. If we spot abnormalities that we aren’t experienced enough to report, a formal echocardiogram needs to be performed.
References/Resources:
- https://radiopaedia.org/articles/b-line-ultrasound
- https://www.acep.org/how-we-serve/sections/emergency-ultrasound/news/dece/fellow-corner-e-point-septal-separation-in-the-patient-with-congestive-heart-failure/
- https://www.bsecho.org/common/Uploaded%20files/Accreditation/Accreditation%20Packs/level_1_accreditation_pack_2020.v6.pdf